
Google Search Console is an indispensable tool for site owners; unlike Google Analytics, which shows you what traffic looks like once it’s on your site, Google Search Console offers a window into your website’s performance within Google’s search results. Among its features, the Performance Report Email is particularly noteworthy. It serves a wealth of data on your site’s visibility and engagement through organic search. Here’s a detailed look at the critical elements of this report.
Table of Contents
Your {Month} performance on Google Search
At the outset, the report presents an overview of your site’s organic search metrics for the month, which include:
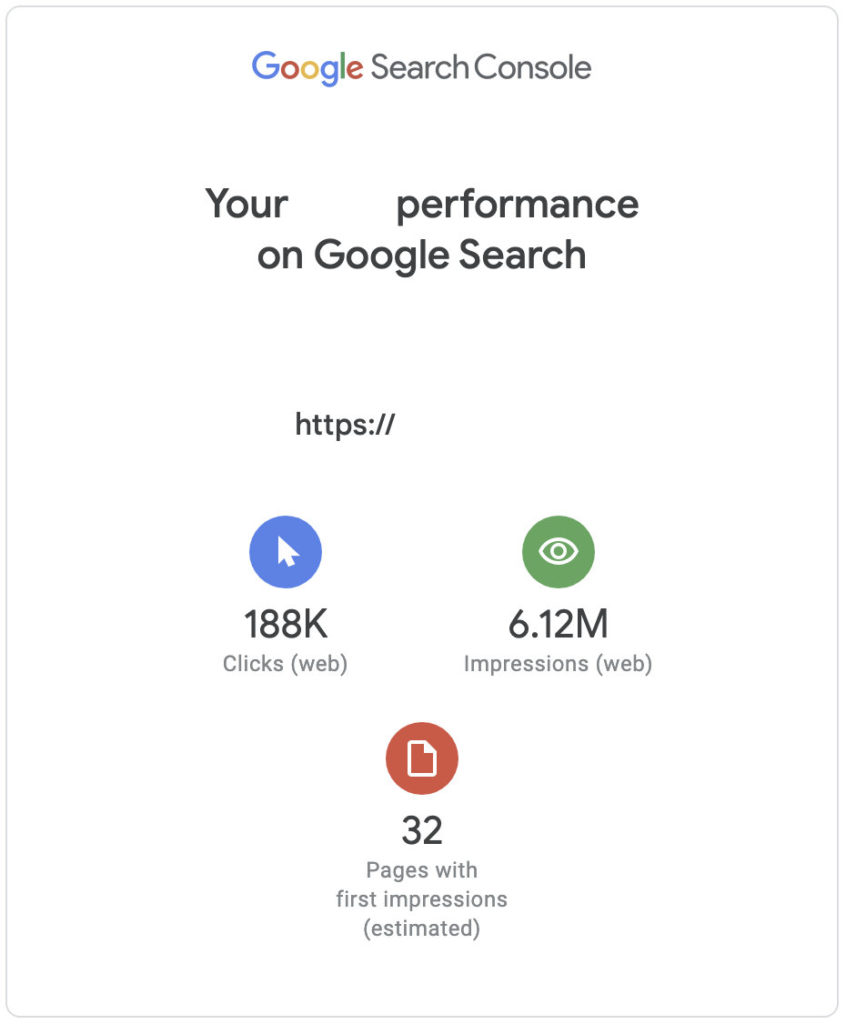
- Clicks (Web): This figure represents the traffic your site has garnered, precisely the number of times users clicked on your site’s pages from Google search results.
- Impressions: A measure of your site’s visibility, reflecting how often your pages appeared in Google search results.
- Pages with First Impressions: This metric highlights new visibility, indicating the pages that appeared in Google search results for the first time.
Understanding these core metrics is foundational. Now, let’s explore other insightful aspects of the report.
Your content achievements
This section of the report shows a closer look at your site’s content performance, with a focus on:
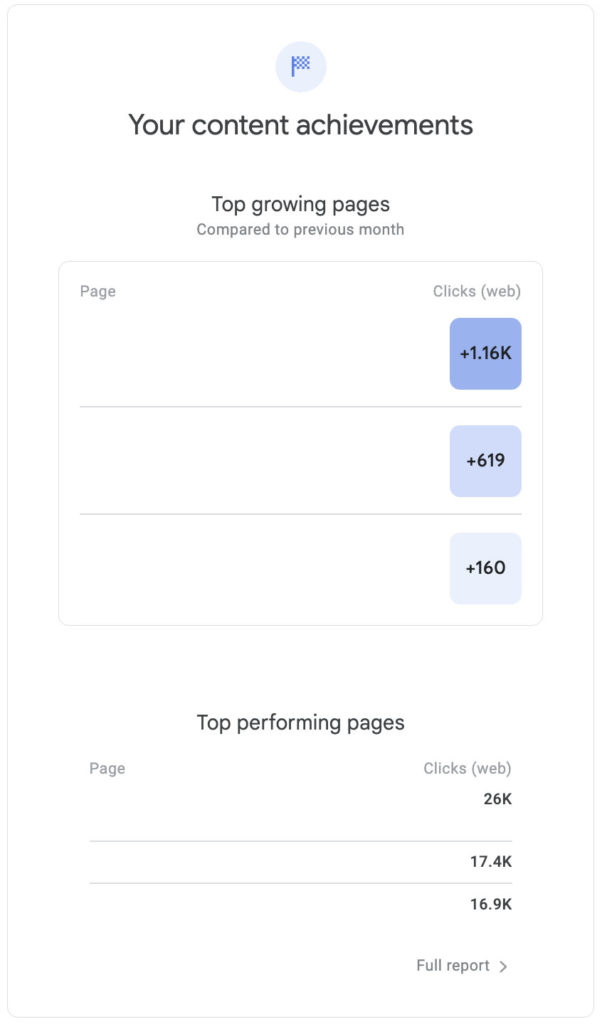
- Top Growing Pages: Identify pages with a notable uptick in total clicks, shedding light on potential drivers like recent events, media appearances, or content trends. Examples:
- If your homepage is listed here, ask yourself: What changed? Did your team make a podcast appearance? Was there a notable product launch? Perhaps a spree of networking at conferences? Such events often drive brand awareness.
- For a career page, a surge might be linked to new job postings.
- Knowledge-based content? It might indicate an improved keyword ranking or a trending topic.
- Top Performing Pages: This section captures the most clicked pages for the month. While these metrics might seem consistent, keep looking for spikes—these could be tied to trending brand content or a piece gaining traction.
A deeper exploration through the “Full Report” link can offer more granular insights, especially when examining specific pages and date ranges.
How do people find you?
The core of your online visibility lies in the search queries that lead users to your site. This section breaks down:
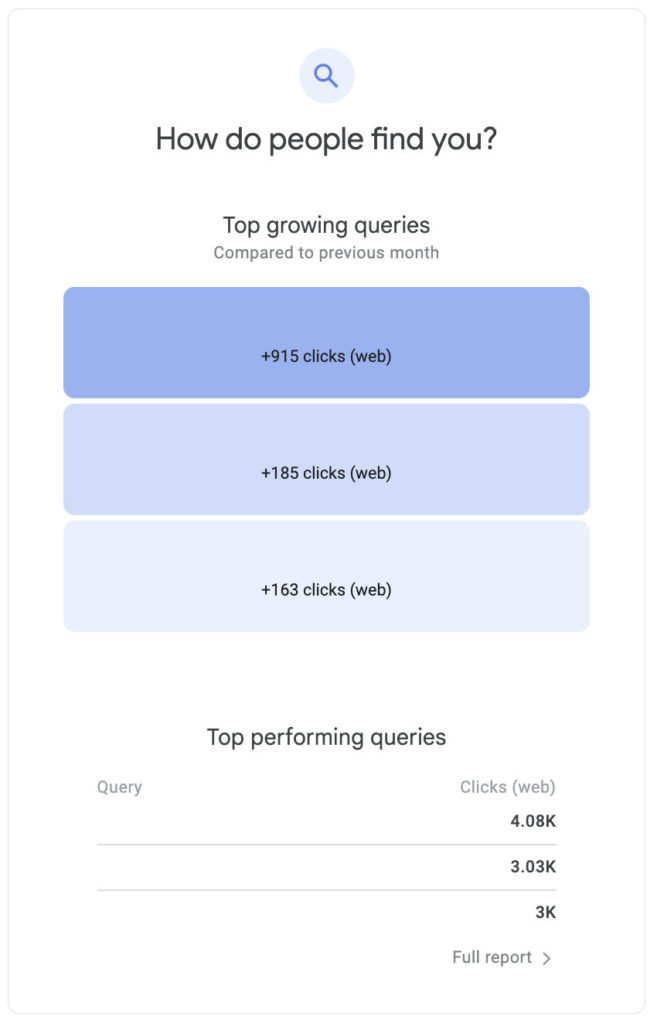
- Top Growing Queries: Uncover search terms that have gained momentum, potentially influenced by brand activities or broader trends.
- Branded Activities: Surges in specific branded queries often align with initiatives to boost brand visibility. This could be because of a recent PR campaign, event sponsorship, leadership speaking engagements, or even appearances on popular podcasts.
- Non-branded: The growth in these search terms often indicates:
- A broader audience seeking information on a trending topic or industry development.
- Achievements in SEO practices, perhaps capturing a wider audience due to better search rankings. When you see this trend, it’s a green light to delve deeper. What modifications contributed to this SEO win? And more importantly, how can these successful tactics be replicated for other content?
- Branded: As mentioned, these are intrinsically linked to brand-centric actions that fortify your brand’s position in the relevant searches.
- Top Performing Queries: Highlight the search terms driving the most traffic, offering insights into successful content and SEO strategies.
- Branded: As mentioned, these are intrinsically linked to brand-centric actions that fortify your brand’s position in the relevant searches.
- Non-branded: Peaks in these areas can result from:
- Evolving interests or emerging trends in your industry.
- Certain web pages have seen a leap in search rankings. Spotting this means it’s time to revisit and possibly replicate the strategies that catalyzed such growth.
This analysis reveals what attracts users and provides strategic insights for optimizing your content and SEO efforts.
Learn about your audience
Gain valuable demographic and behavioral insights into your audience, including:
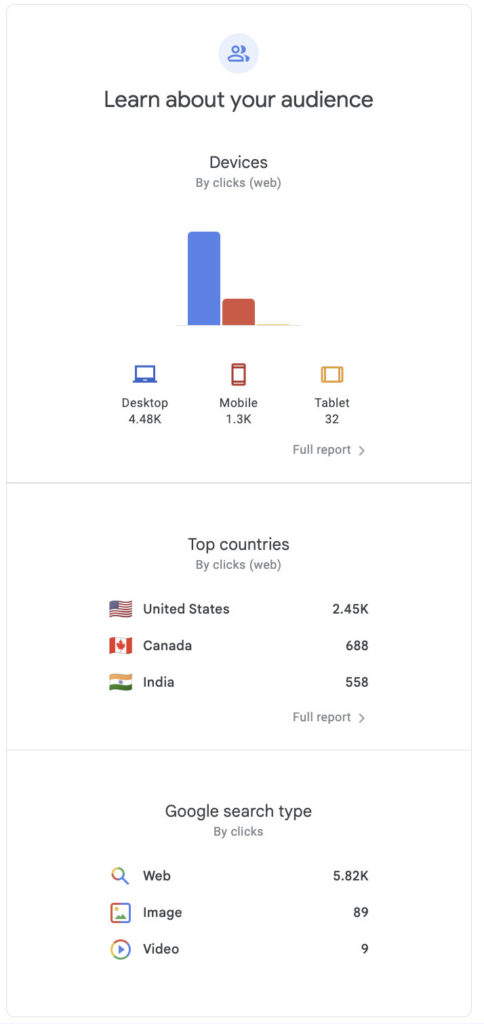
- Devices: Understand the preferred devices of your visitors, guiding your optimization priorities.
- Top Countries: See where your audience is geographically concentrated, informing potential market expansion strategies.
- Search Type: Break down the types of Google searches driving traffic to your site, allowing for targeted optimization strategies.
- Web: The conventional Google search.
- Image: Have you noticed a surge in image search traffic? Check which images rank well and optimize them. Consider filename, alt text, and design tweaks, like adding color to distinguish your image from monochromatic search results.
- Video: Significant video query traffic? Review and optimize the video presentation in search results, including the thumbnail, title, and description.
- News: For those seeking prominence in Google News, ensuring high-quality content and aligning with Google News content policies is essential.
These insights are crucial for refining your SEO strategies and enhancing user experiences.
Diving deeper into Google Search results
While the Google Search Console summarizes your site’s performance in its emails, the actual depth of its offerings can only be unlocked by logging into the platform itself. This next logical step opens up a wealth of detailed analytics and features not covered in the email summaries. Inside Google Search Console, you’ll find extensive data on aspects like search appearance, structured data’s impact on your site, core web vitals, mobile usability, and much more. Here, you can dig into how your site interacts with Google Search, enabling a deeper analysis and more strategic optimizations for your online presence. It includes:
- Google Search Console Links and URL Inspection Tool: These features help you understand how Google views your site, from indexed pages to external links and the relevance of specific pages.
- Structured Data and Search Appearance: Analyze how structured data impacts your site’s presentation in search results, including rich results and AMP pages.
- Core Web Vitals Data and Mobile Usability: These metrics provide insights into the user experience and highlight areas for improvement on mobile devices and desktops.
- Coverage Report and Request Indexing: Understand the coverage of your site’s pages in Google’s index and take action to request indexing for new or updated content.
- Manual Actions and Security Issues: Stay informed about any manual actions taken by Google or security issues that need addressing to maintain your site’s integrity in search results.
By weaving these elements into your analysis, you’ll gain a comprehensive understanding of your site’s performance in Google search. This will enable informed decisions to enhance visibility, engagement, and success in the digital landscape.